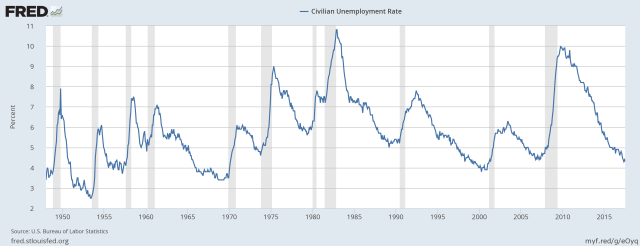
Short-term credit cycles usually happen by prolong borrowings and building of debt, which are then followed by deleveraging; typically they last around 10 years. These cycles are defined by the booms, recessions and recoveries that economies go through. You can see these cycles in the chart below from 1947 till present very well depicted in the rise of unemployment during recessions.
In our regular watch over the US economy it is very important to look at what and why one of the most important participants/regulators in US is doing – The Federal Reserve Bank. The “Fed” is typically trying to control short-term credit cycles in order to help the economy get through recessions easier and less painful. They are doing that normally by two ways – controlling short term (overnight) borrowing cost and open market operations. When the Federal Reserve notices excessive borrowing and debt creation it will raise the short term rates which will translate down the system.
In the past three recessions, as we can see below, the short term interest rate – Federal Funds Rate, was elevated quite substantially to over 5 per cent.
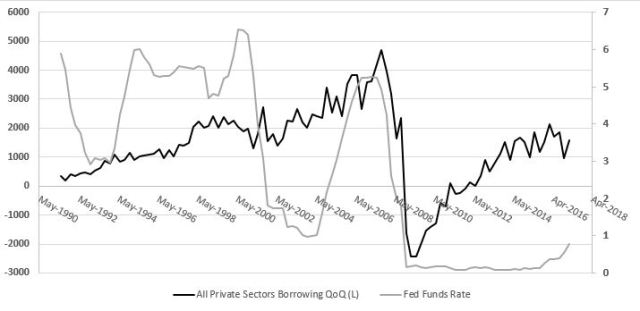
Two major trends we find very interesting from this observation. First is how the interest rate moves with borrowing. This is most visible between the past two recessions – The Dot Com Boom and The Great Recession, where private sector borrowing continued rising over 2 trillion per quarter up until the last recession. Second we can see that with every next recessions the interest rate was lowered to a new low – from 3 per cent. in 1992 to 1 in 2001 and to almost 0 in 2007.
The second trend is more related to the long-term credit cycle, which is a theme for another discussion. Here we will focus more on the rise of interest rates and we will look in some details of the recent borrowing trends. In the chart below you can see the private sector borrowing striped into its two major components – household borrowing and non-financial business borrowing. We can clearly see that the 2001 recession had bigger impact on corporate borrowing than on household borrowing, as the later continued rising until the Financial Crisis. Corporate borrowing fell to zero in 2003 only to sharply rise and surpass that of households by 2007.
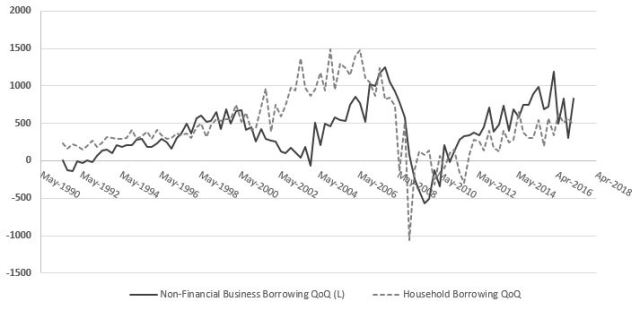
After the latest recession we can see that household borrowing has returned to 2001 levels, however corporate borrowing has passed over that level and reached to 2007 levels. It seems that the rate rises from the past year is having some effect on corporate borrowing, but it was only short term and maybe the Fed will continue raising rates. Also, after comparing below the financial sector borrowing with that of non-financial it is very visible due mostly to regulation, that the financial sector borrowing is stable at around 500 billion per quarter.

All in all we can say that the current credit cycle is maturing and that this time excessive debt is building in the corporate sector of US. We will continue to observe Federal Reserve rate rise in the near future, however it seems that during the next recession we might observe a lot of corporate defaults, which could suppress stock prices. This will present many buying opportunities, but in the mean time we can utilize some derivatives strategies as we expect severe downturns in the stock market.